


A Comprehensive Analysis – By: Shri Atul Kumar Mishra
The footwear industry within the United States pulsates with vibrancy and dynamism, uniquely characterized by a fusion of high per capita income, the globe’s largest economy, and a longstanding tradition of housing some of the world’s premier footwear labels.
Flourishing on a diverse range of factors, including incessant innovation, continuous enhancements spanning design, style, materials, comfort, and colors, this market boasts exceptional growth and resilience. Furthermore, its adaptability and responsiveness to shifting consumer preferences across various footwear categories underscore its robustness.
A pivotal driving force behind the U.S. footwear market is the nation’s elevated per capita income. Bolstered by a robust economy and a populace with considerable disposable income, Americans willingly invest in superior footwear that not only embodies comfort and style but also mirrors their individuality and lifestyle choices. This economic canvas has facilitated the establishment of globally acclaimed footwear brands, each striving to capture a segment of this lucrative market.

Innovation stands as a cornerstone of the U.S. footwear market. Brands engage in an ongoing competition to outshine one another by integrating the latest trends and cutting-edge technologies into their offerings. Be it through the adoption of pioneering materials, sustainable practices, or ergonomic designs, American footwear companies spearhead the development of products that cater to the ever-changing demands of consumers.
The significance of design, style, materials, comfort, and color reverberates profoundly within the U.S. footwear landscape. Consumers seek footwear that transcends mere functionality, serving as an expression of their personality and fashion inclinations. Acknowledging this sentiment, footwear brands heavily invest in research and development to deliver products that not only meet but exceed these expectations. Whether crafting athletic footwear engineered for peak performance or fashion-forward boots that set trends, the U.S. footwear market offers a comprehensive spectrum of options.
Footwear, renowned for its challenging return rates, intricate SKU (Stock Keeping Unit) management, and costly manufacturing processes, has historically presented a formidable obstacle for global brands. Therefore, it is imperative for companies to maintain a vigilant awareness of the continuously evolving landscape of the footwear market to retain their competitive advantage.
Global footwear sales encountered a significant challenge attributed to supply chain constraints and surging prices, resulting in a noticeable decline in sales during the third and fourth quarters of 2022, falling well below expectations. However, there are promising signs of recovery as we progress into the year 2023. A survey conducted by AlixPartners revealed that approximately 43% of women and nearly one-third of men cited inflation as the primary reason for deprioritizing their shoe shopping.
The global footwear market is forecasted to achieve revenues of US$398.40 billion in 2023, with an anticipated annual growth rate of 3.47% (CAGR 2023-2028). In terms of revenue generation, the United States leads the global market, with an estimated value of US$88.47 billion in 2023. The U.S. footwear market stands as one of the largest in the world, having reached a total value of over $79.2 billion in 2020, and now surpassing $88.5 billion in 2023. It constitutes a significant portion of the U.S. retail industry, contributing substantially to consumer expenditure on fashion goods. The U.S. footwear market has consistently demonstrated growth, rising from an estimated $79.2 billion in 2020 to its current revenue level. Projections suggest a 3.29% growth in the U.S. footwear market from 2023 to 2028, culminating in a market value of $104.00 billion by 2028. The market’s resilience during economic downturns underscores a steady demand for footwear.

Per capita footwear consumption in the USA stands at approximately 7.5 pairs per person annually, making it one of the highest rates globally. Comparatively, the global per capita footwear consumption hovers around 3.7 pairs per person, making U.S. citizens’ footwear consumption nearly double the global average. This equates to an annual expenditure of about $200 per person on footwear by U.S. consumers.
Current Footwear Import Trends in USA
Since 2017, the U.S. footwear market has exhibited consistent growth, driven by robust consumer demand for high-fashion products and the ongoing strategic investments made by footwear brands in design innovation and diversification of sourcing options. This approach is essential for meeting the evolving and dynamic style, color, and quality preferences of American consumers.
Fig 1.1 : Footwear Imports of USA
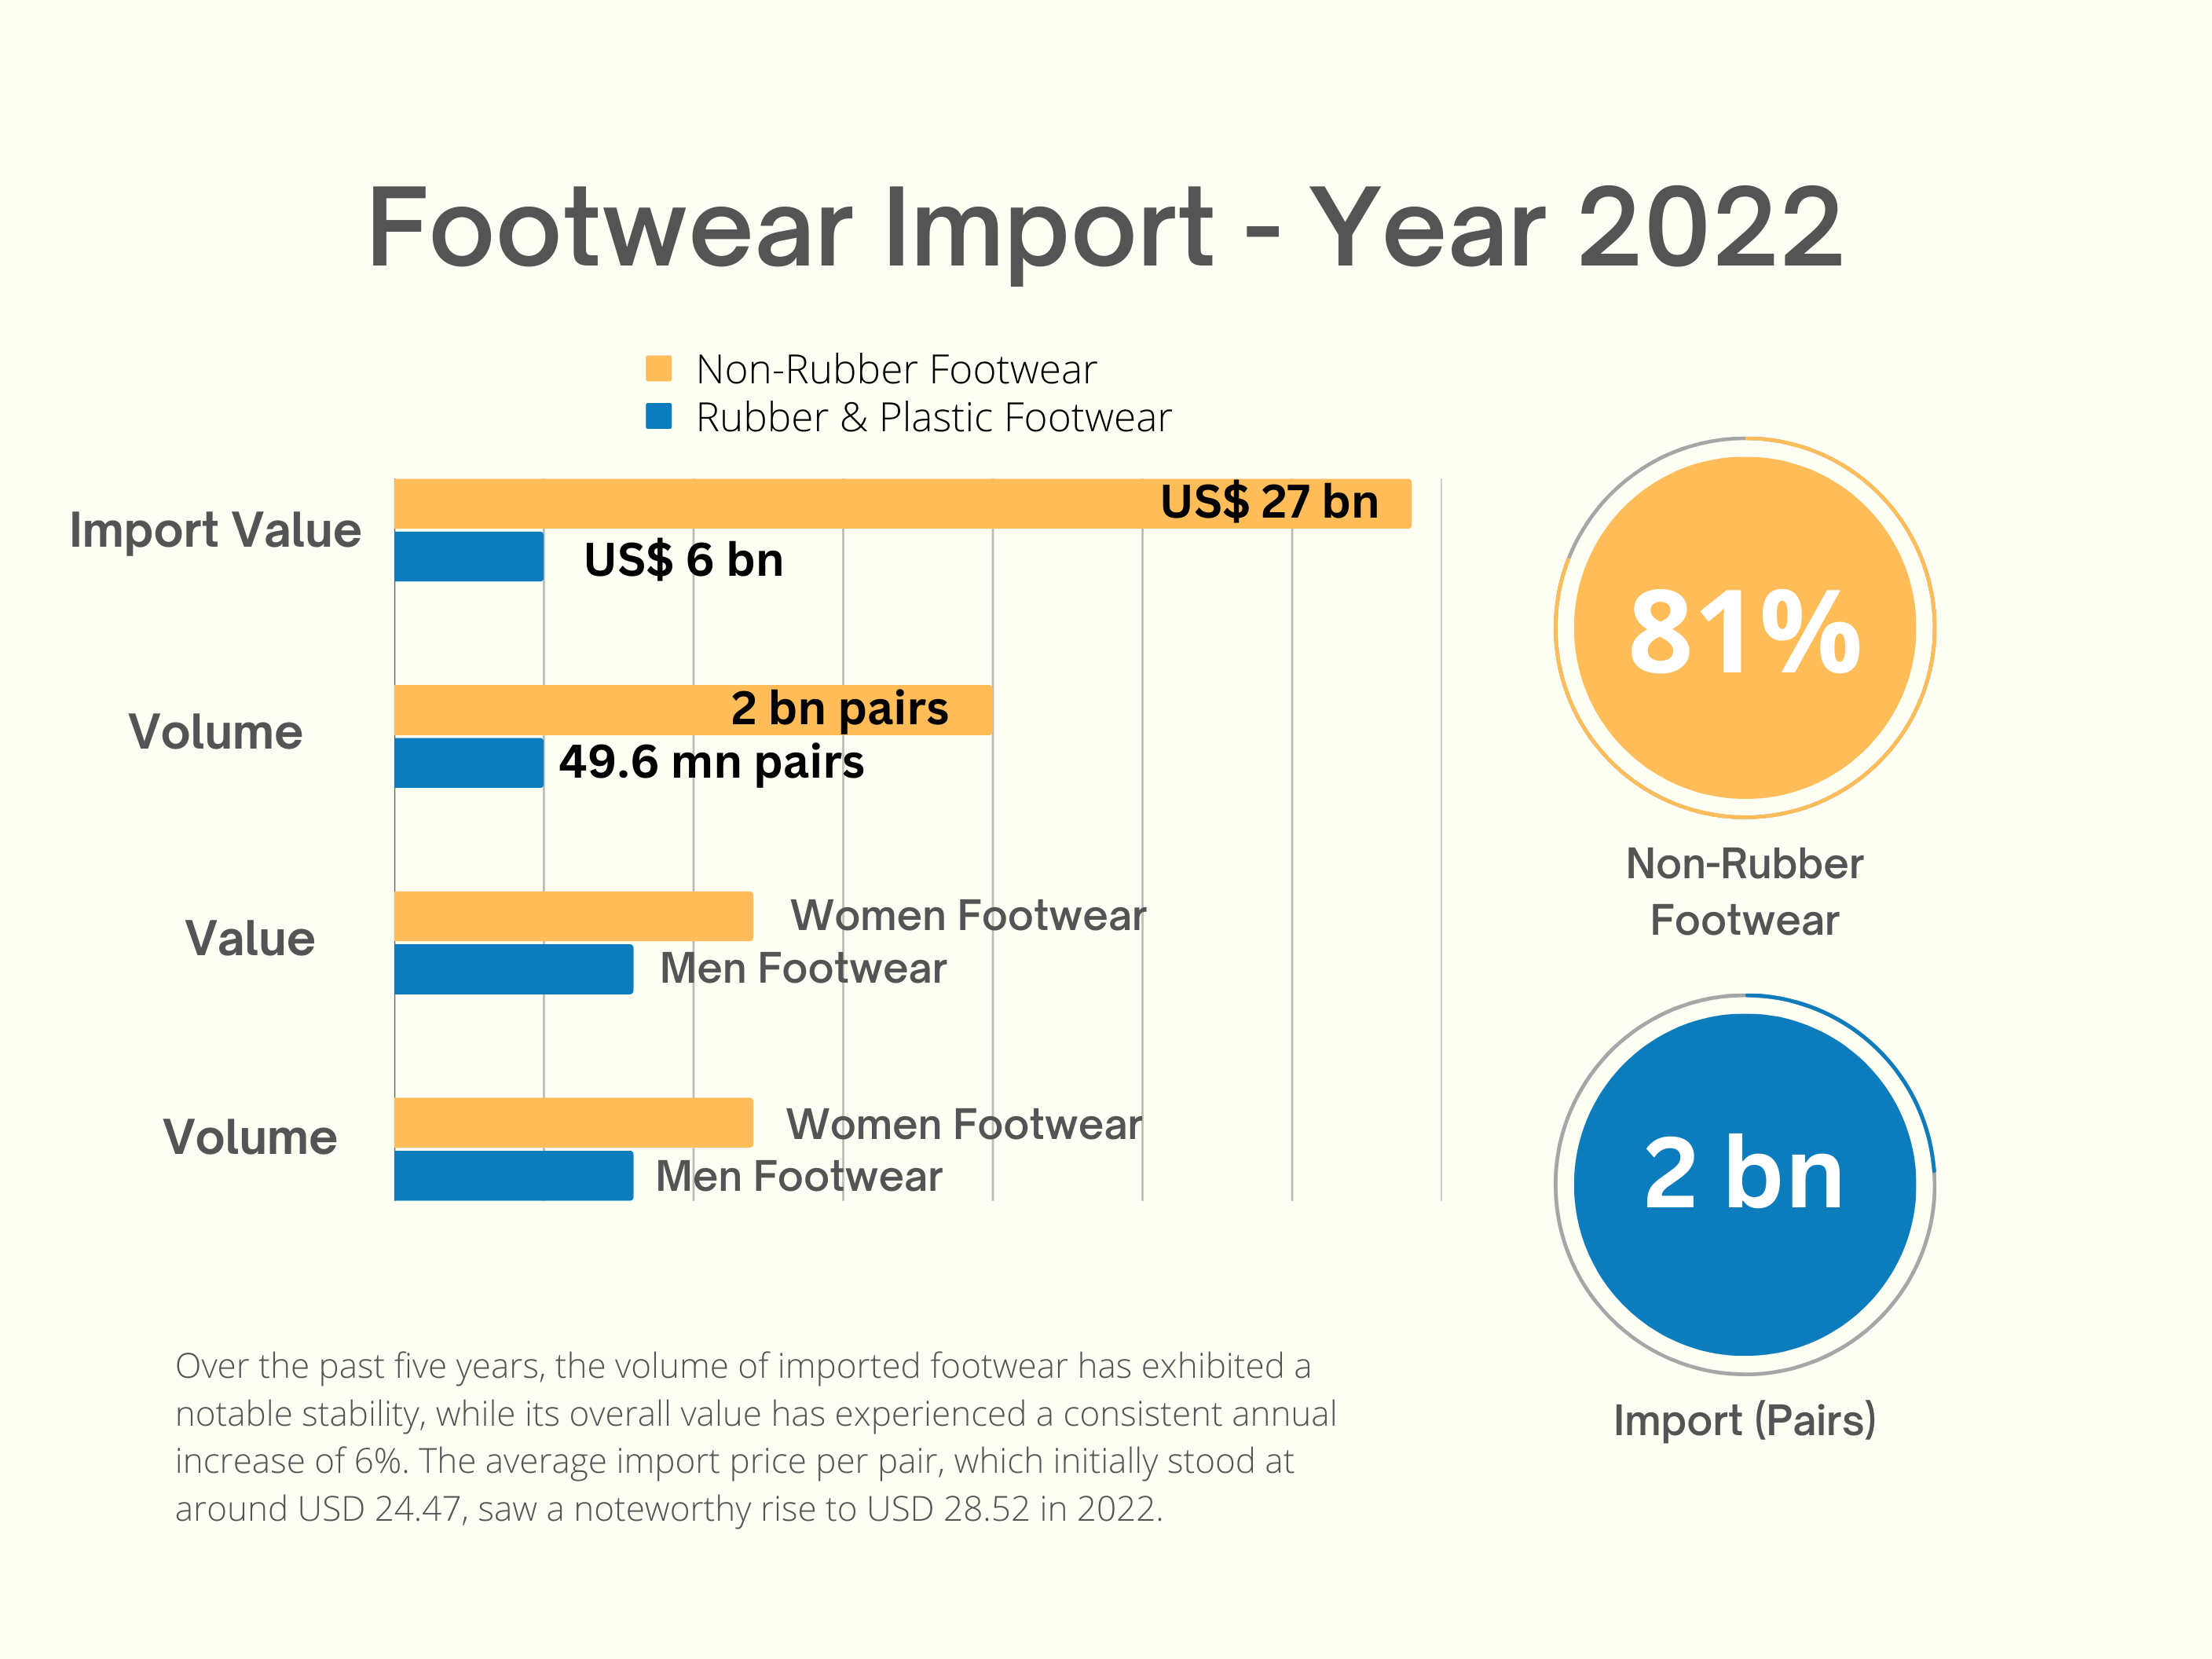
As illustrated in Figure 1.1, the United States’ footwear imports in 2022 amounted to a total value of USD 34 billion, equivalent to approximately 2 billion pairs in terms of quantity. Notably, over the past five years, the volume of imported footwear has exhibited a notable stability, while its overall value has experienced a consistent annual increase of 6%. The average import price per pair, which initially stood at around USD 24.47, saw a noteworthy rise to USD 28.52 in 2022.
Breaking down these imports, ‘All Non-Rubber Footwear’ comprised approximately 81% of the total value, with ‘Plastic & Rubber Footwear’ constituting the remaining 19%. In terms of quantity, ‘Plastic & Rubber Footwear’ accounted for about 21%, while ‘All Non-Rubber Footwear’ constituted 79%. An intriguing observation is that the value and quantity share of ‘Plastic & Rubber Footwear’ has seen an upward trend in the last five years, whereas ‘All Non-Rubber Footwear’ has experienced a decline.
On average, ‘All Non-Rubber Footwear’ was imported at a per-pair cost of USD 26.35, a figure that ascended to USD 31.4 in 2022. Conversely, ‘Plastic & Rubber Footwear’ had an import price of USD 14.3 per pair in 2017, which showed a modest increase to USD 15.8 in 2022. In terms of quantity, the U.S. imported approximately 496 million pairs of plastic footwear and roughly 1,504 million pairs of non-rubber footwear in 2022.
In a similar vein, an examination of other footwear categories is presented below. OTEXA has delineated six additional categories, which encompass women’s footwear, men’s footwear, rubber canvas footwear, home slippers, protective footwear, and other footwear. In the year 2022, women’s footwear held the largest share in the total value of footwear imports in the USA at 34%, followed by other footwear at 24.6%, men’s footwear at 21.9%, rubber canvas footwear at 17.7%, home slippers at 0.83%, and protective footwear at 0.77%. These imports translated to approximately 906 million pairs of women’s footwear, 588 million pairs of other footwear, 474 million pairs of rubber canvas footwear, 388 million pairs of men’s footwear, 93.4 million pairs of home slippers, and 22.4 million pairs of protective footwear.
Fig 1.2: Footwear Imports of USA
Contrary to initial perceptions, the per-unit import price of footwear in the United States across these diverse segments has shown a consistent growth trend over the past five years, albeit at varying rates. Notably, women’s footwear has seen a per-pair import price growth of 0.7% annually, while other categories such as rubber canvas footwear have exhibited a 1.1% annual growth, and protective footwear has experienced a 0.8% annual increase in per-pair import prices. Remarkably, home slippers have recorded the most substantial yearly growth in per-pair import prices, with an impressive average of 9.1%, followed by other footwear with 6.7%, and men’s footwear at 2.8% over the same five-year period.
Regarding their value, volume, and unit price dynamics, I have undertaken an analysis to categorise these segments and identify those that exhibit growth trends across all three dimensions: value, volume, and unit price.
Fig 1.3: Footwear Imports of USA
Value Growth Category (2017-22):
As depicted in Figure 1.3, the import of protective footwear has demonstrated the most robust annual growth in terms of import value, with men’s footwear and rubber canvas footwear following closely behind. In contrast, home slippers have exhibited the lowest rate of growth in import value.
Volume Growth Category (2017-22):
Likewise, when considering volume growth, the visual representation in Figure 1.4 showcases products categorized according to their growth patterns. In terms of quantity, the United States has witnessed the most significant import growth in protective footwear, with men’s footwear and rubber canvas footwear closely trailing behind. In contrast, other footwear and home slippers have experienced the lowest yearly import growth from 2017 to 2022.
Unit Price Growth (2017-22):
Footwear import prices in the U.S. market exhibit a dynamic pattern influenced by the interplay of design, style, and material preferences sought by manufacturers and the demands of brands and retailers. Our analysis over the past five years as visualised below in figure 1.5 reveals a noteworthy fluctuation in per-pair prices, particularly within the spectrum of imported footwear categories. Home slippers stand out as one category that has experienced the most pronounced price escalation within the U.S. market, followed by other footwear and men’s footwear. In contrast, categories such as women’s footwear, protective footwear, and rubber canvas footwear have displayed either minimal or negligible increases in their import prices over the same five-year period.
Countries Exporting Footwear to the USA
Over the past five years, the growth dynamics in both the value and volume of footwear imports in the U.S. market have exhibited fluctuations. In terms of volume, the United States relies heavily on five key footwear-supplying countries, namely China (55.1%), Vietnam (25.3%), Indonesia (7.1%), Cambodia (3.0%), and India (1.7%). Collectively, these nations account for approximately 93% of the total footwear imports to the United States from around the world.


Among these top five exporting countries, Cambodia and Indonesia have notably increased their volume share at a rapid rate. India has also experienced an upward trajectory, albeit at a slower pace. Conversely, China has decelerated its volume share, reducing from 71% in 2017 to 55% in 2022. In the year 2022, China exported approximately 1.4 billion pairs of footwear to the U.S., with Vietnam following at 625 million pairs, Indonesia at 189 million pairs, Cambodia at 74 million pairs, and India at 41 million pairs (refer to Figure 1.4).
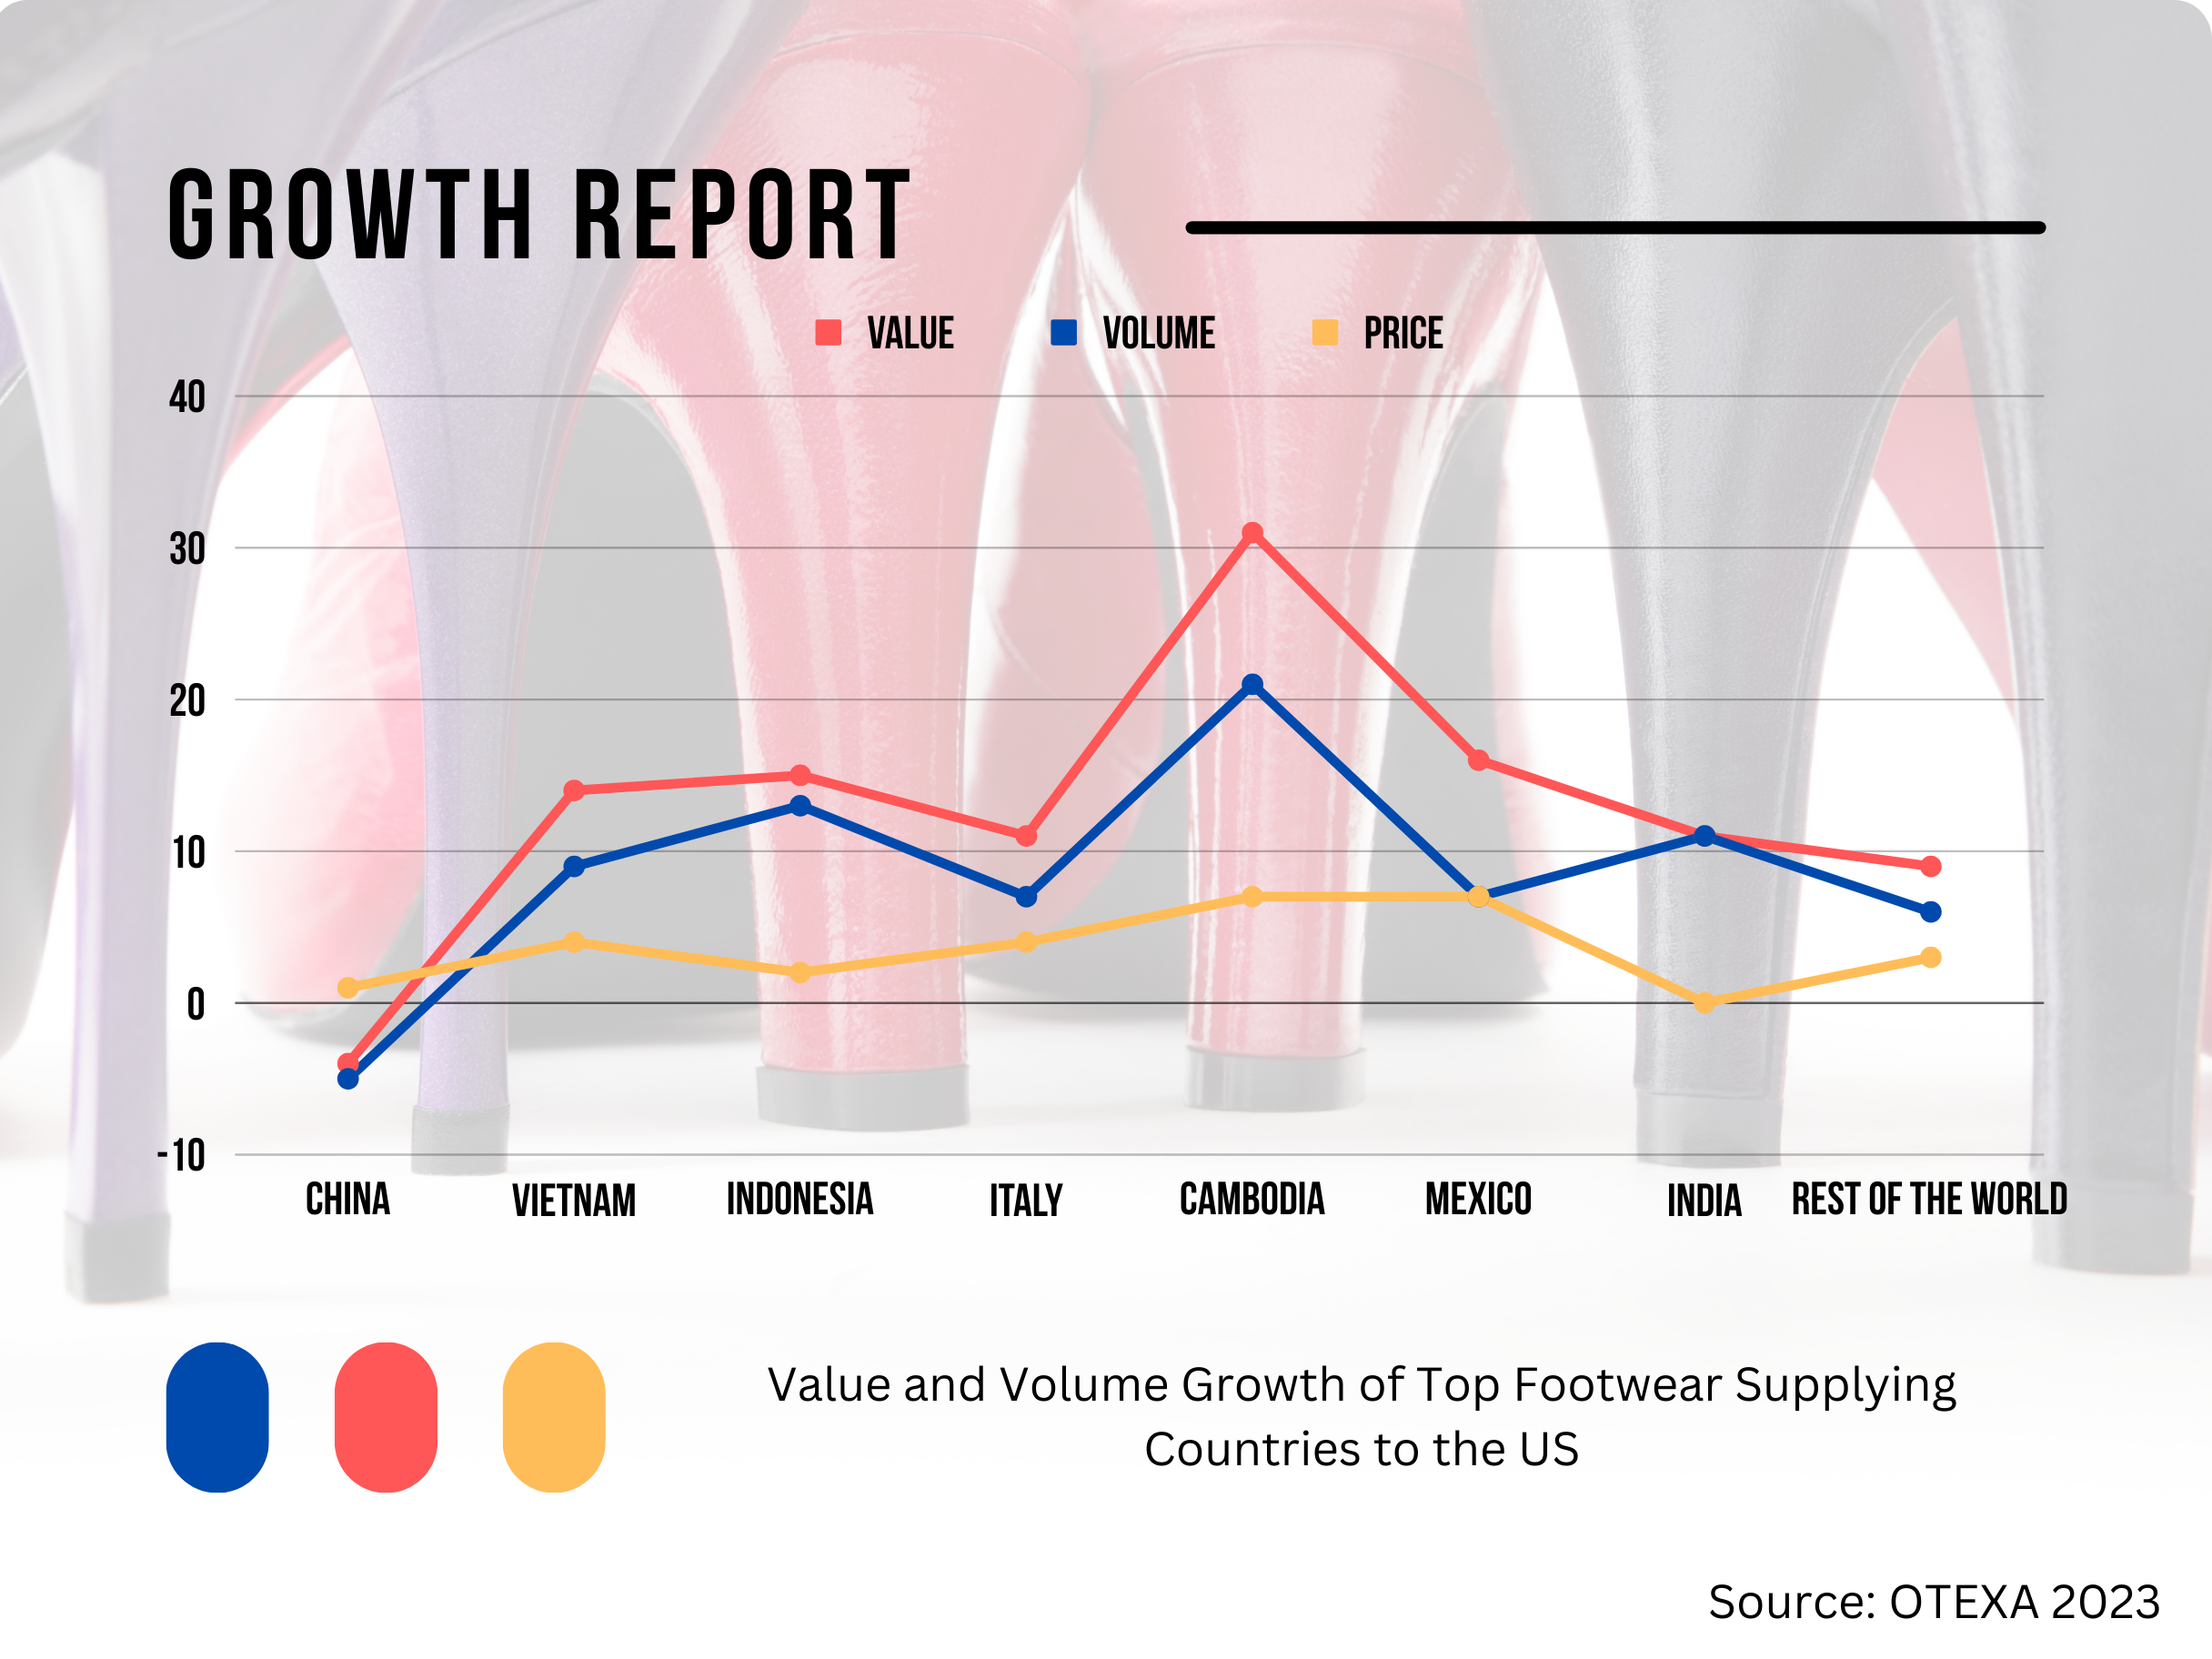
Fig. 1.4: Value and Volume Growth of Top Footwear Supplying Countries to the US
When examining the narrative of value growth, a distinct pattern emerges. While China and Vietnam maintain their positions as the top two footwear suppliers to the USA, it’s worth noting that India does not rank among the top five suppliers in terms of value. Instead, in 2022, India’s position is supplanted by Indonesia, Italy, Cambodia, and Mexico. India holds the seventh position as a footwear supplier to the US in terms of value, having exported approximately USD 745 million worth of footwear to the US in 2022, representing an increase of nearly USD 297 million compared to 2017.
In value terms, the top five suppliers, which include China (36.1%), Vietnam (31.1%), Indonesia (8.9%), Italy (7.0%), and Cambodia (3.0%), collectively accounted for approximately 86% of the total footwear imports to the USA in 2022. In contrast, India contributed only 2.2% to the total footwear imports of the US in 2022.
Fig 1.5: Footwear Imports of USA
Import from India
In 2022, India’s footwear exports to the United States reached a total worth of USD 745 million, equating to 41 million pairs of footwear. India’s exports to the U.S. have been exhibiting robust growth trends, with an impressive annual increase of 10.7% in value since 2017 and a substantial 9.9% growth in volume during the same period. Footwear imports in the U.S. have shown varied growth rates since 2017. Within the spectrum of India’s total footwear exports to the U.S., men’s footwear commands a significant share, contributing to 39% of the volume and 31% of the value.
On the other hand, other categories of footwear exhibit substantial volume dominance, accounting for 44%, while also making a significant mark in value terms with a 37% share in the total footwear imports from India in 2022. In contrast, categories such as women’s footwear, protective footwear, rubber canvas footwear, and home slippers hold comparatively lower shares both in volume and value when compared to the other categories.
Fig 1.6: Footwear Imports of USA
Notably, India’s performance in terms of per-pair import prices has not been particularly robust. Among the categories mentioned, the average import price in the U.S. for footwear imported from India was highest for rubber canvas footwear, with a growth of 4.0% in 2022, followed by men’s footwear at 3.4%, other footwear at 1.8%, women’s footwear at 1.7%, protective footwear at 0.5%, and home slippers at 0.7%.
On an average per pair import prices for footwear import in US from India are highest for men’s footwear (USD 22.29 per pair), followed by women footwear (USD 19.76 per pair), protective footwear (USD 18.72 per pair), other footwear (14.76 per pair), home slippers (USD 9.8 per pair) and rubber canvas footwear (9.75 per pair) for the year 2022.
In the context of footwear imports from india to the United States, the average per-pair import prices vary across categories. Notably, men’s footwear commands the highest per pair import price, standing at USD 22.29 per pair, followed by women’s footwear at USD 19.76 per pair, protective footwear at USD 18.72 per pair, other footwear at USD 14.76 per pair, home slippers at USD 9.80 per pair, and rubber canvas footwear at USD 9.75 per pair in the year 2022.
Fig 1.6: Footwear Imports of USA from India
Diversity is a defining characteristic of the US consumers base, and this diversity extends to preferences for various categories of footwear. From sneakers for active individuals to high-end leather shoes for formal occasions, the market caters to a wide range of tastes. This diversity necessitates that brands offer a broad spectrum of products, from casual to formal, to ensure they capture the attention of every segment of the population.
In an era of economic uncertainty, it’s not surprising that footwear purchases have taken a backseat. However, this scenario becomes intricate when considering the wide spectrum of the footwear market, ranging from essential items like athletic shoes to discretionary fashion footwear. As a result, the impact of the economic downturn varies across brands. Even the resilient sneaker market has exhibited signs of strain, transitioning from a robust 19.5% growth rate in 2021 to a modest 2.7% increase in 2022. Interestingly, dress shoes have seen a resurgence, as 45% of American and British men express intentions to invest in such footwear in 2023.
The intersection of economic challenges and evolving consumer preferences makes it a formidable task for footwear brands to secure dependable market insights. In the interim, brands are trying to seize this period to reposition their offerings and gain a deeper understanding of their core customers’ desires.
Historically, purchasing footwear online has posed a significant challenge for consumers, as photographs and sizing information can only go so far in conveying how a pair of shoes will feel on one’s feet. Interestingly, the e-commerce landscape for footwear experienced a notable surge during the COVID-19 pandemic, when physical stores were forced to close due to stay-at-home mandates. This trend, however, has proven to be enduring, even with the resurgence of physical retail.
According to the 2022 Power Reviews’ State of Apparel & Footwear Shopping survey, a substantial 74% of footwear purchases now take place online. Casual footwear leads the way at a remarkable 96%, followed closely by athletic footwear at 84%. So, what has fostered this newfound comfort in online shoe shopping.
Product Trends: Athletic shoes continue to lead the market, followed by casual and dress shoes. Comfort and sustainability are among the key design priorities.
Fig. 1.7: US Footwear Import from India
Design & Technology: Smart shoes with integrated sensors and tracking devices are receiving increased attention, as are wearable technology and 3D printing.
Price Trends: Consumers are increasingly looking for value in footwear. While premium brands still have their niches, mid-priced and licensed products are seeing increased growth.
In a landscape increasingly wary of greenwashing and deceptive marketing practices, transparency has emerged as a highly desirable attribute. According to CGS’ annual Retail & Sustainability Survey, 50% of U.S. consumers believe that brands are not adequately showcasing their sustainable efforts, and 27% believe that brands have room for improvement in this regard. In a surprising twist, sportswear giant Puma, typically not associated with sustainability, is making substantial strides in the realm of circular footwear. They’ve set ambitious sustainability targets, aiming to incorporate sustainable components into 90% of their footwear by 2025. This includes the development of recycled leather, rubber, and polyurethane that can be efficiently recycled in-house. Earth Brand, on the other hand, goes beyond sustainable footwear, committing to the use of FSC-certified recyclable paper and soy-based inks in their packaging.
Conclusion
In recent years, there has been a noticeable shift in consumer behaviour within the U.S. footwear market. A growing awareness of environmental and social responsibility has led to an increased focus on sustainability and responsible sourcing. Consumers are now looking beyond the design and comfort of their shoes; they also consider the environmental and ethical impact of their purchases.
Footwear brands have taken heed of this shift and are increasingly incorporating sustainable practices into their sourcing and manufacturing processes, such as using eco-friendly materials and reducing their carbon footprint. the U.S. footwear market thrives on a combination of factors that include high per capita income, a strong economy, the presence of top global brands, constant innovation in design and materials, and the ability to cater to diverse consumer preferences.
The market’s adaptability and willingness to embrace sustainability and responsibility in sourcing and manufacturing positions it as a dynamic and forward-thinking segment within the broader fashion industry. With a continued commitment to excellence and an eye on sustainable practices, the U.S. footwear market is poised for a promising future that blends style, comfort, and conscience.
================================================================atul.jnu@gmail.com